To derive the overtopping rate, there are two way.
First approach is to formulate the overtopping rate ![]() by the overtopping
volume
by the overtopping
volume ![]() and wave period
and wave period ![]() .
Another approach is to formulate the overtopping rate
.
Another approach is to formulate the overtopping rate ![]() by
by
![]() and
wave amplitude
and
wave amplitude ![]() .
First approach is reasonable to formulate the mean wave overtopping rate
.
First approach is reasonable to formulate the mean wave overtopping rate
![]() and second one is good to formulate the maximum wave overtopping rate
and second one is good to formulate the maximum wave overtopping rate  .
In this section, we try to formulate the maximum overtopping rate
by using
.
In this section, we try to formulate the maximum overtopping rate
by using
![]() and
and ![]() .
.
It is assumed that the profile of the individual wave crest is assumed to be a sinusoidal wave locally as same as previous section.
Assuming a linear sinusoidal wave for velocity field, the maximum
overtopping rate on the deck is occurred at the crest and it can be described by
 up to
up to 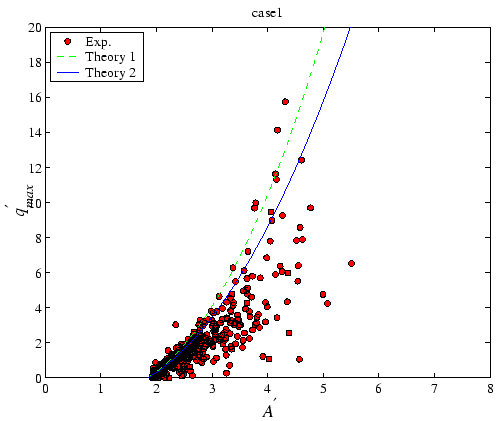 in Eq.(21)
and substituting Eq.(21) into (31) gives the maximum overtopping rate as a function of wave crest amplitude
in Eq.(21)
and substituting Eq.(21) into (31) gives the maximum overtopping rate as a function of wave crest amplitude 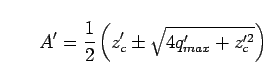 is enough smaller than 1,
Eq.(32) can be reduced into quadric function for
is enough smaller than 1,
Eq.(32) can be reduced into quadric function for  =0.1 and 0.3, respectively.
Therefore, this assumption is not cruel for linear regular waves for
small wave steepness.
This will be verified by the experimental data later.
The maximum overtopping rate by Eq.(33) is
independent of wave steepness, because by
=0.1 and 0.3, respectively.
Therefore, this assumption is not cruel for linear regular waves for
small wave steepness.
This will be verified by the experimental data later.
The maximum overtopping rate by Eq.(33) is
independent of wave steepness, because by  ,
,
|
=11cm
![\epsfbox[47 184 550 606]{figures/exp_amp-q2_case1.eps}](img178.png)
![\includegraphics[width=11cm]{figures/exp_amp-q2_case1.eps}](img180.png)
(a) Case 1.
=11cm ![\includegraphics[width=11cm]{figures/exp_amp-q2_case2.eps}](img181.png)
(b) Case 2. |
Before formulate the PDF of the maximum overtopping rate model,
it is necessary to check the assumptions used in the derivations again.
A local sinusoidal velocity field and small steepness were
assumed for relatively large amplitude waves.
To check these assumptions,
Fig.18 compares the measured relationship between
normalized wave crest amplitudes ![]() and maximum overtopping
rate
and maximum overtopping
rate
![]() with the approximated solution by Eq.(32)
and simplified solution by Eq.(33).
There is no significant difference between the approximated solution,
Eq.(32), and simplified solution, Eq.(32).
The both of the solutions give nice agreement with the measured data.
The correlation coefficients between the simplified solution,
Eq.(33), and the experimental results are
0.81 for Case 1 and 0.90 for Case 2, respectively.
This result is inconsistent with ugly relationship between
with the approximated solution by Eq.(32)
and simplified solution by Eq.(33).
There is no significant difference between the approximated solution,
Eq.(32), and simplified solution, Eq.(32).
The both of the solutions give nice agreement with the measured data.
The correlation coefficients between the simplified solution,
Eq.(33), and the experimental results are
0.81 for Case 1 and 0.90 for Case 2, respectively.
This result is inconsistent with ugly relationship between
![]() and
and ![]() because the correlation coefficients between
because the correlation coefficients between
![]() and
and ![]() are less than 0.3.
The main reason of this agreement is that the measured
are less than 0.3.
The main reason of this agreement is that the measured
![]() is
estimated by
is
estimated by ![]() and
and
![]() that gives one point data with vertically uniform profile assumption.
Thus, the assumptions of local sinusoidal velocity filed and small
steepness are valid for large amplitude waves with small steepness
and relatively high deck level condition.
that gives one point data with vertically uniform profile assumption.
Thus, the assumptions of local sinusoidal velocity filed and small
steepness are valid for large amplitude waves with small steepness
and relatively high deck level condition.
Solving Eq.(34) for ![]() , we have
, we have
distribution based on a modified form of the
Rayleigh wave amplitude distribution and is simply referred to as the
``modified Rayleigh overtopping rate distribution" hereafter for clarity.
loped a theoretical framework for the
| =11cm
|
| =11cm
|
|
=11cm
![\epsfbox[50 185 547 592]{figures/expQpdfcase1.eps}](img114.png)
(a) Case 1.
=11cm ![\epsfbox[50 185 547 592]{figures/expQpdfcase2.eps}](img115.png)
(b) Case 2. |
|
=11cm
![\epsfbox[50 185 547 592]{figures/expQexccase1.eps}](img118.png)
(a) Case 1.
=11cm ![\epsfbox[50 185 547 592]{figures/expQexccase2.eps}](img119.png)
(b) Case 2. |
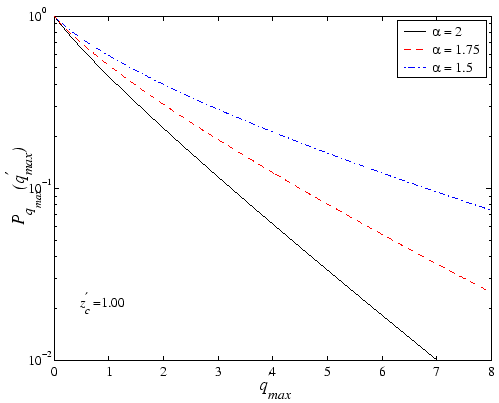
Fig.19 shows the sensitivity of the exceedance
probability of the modified Weibull overtopping rate distribution on ![]() for the case of
for the case of ![]() =1.0 and
=1.0 and ![]() =0.1.
With a change in
=0.1.
With a change in ![]() from
from ![]() =1.5 to
=1.5 to ![]() =2,
the exceedance the derivations.
probability of decreases one order of magnitude
at
.
The
=2,
the exceedance the derivations.
probability of decreases one order of magnitude
at
.
The
![]() decrease is slower than overtopping volume
decrease is slower than overtopping volume ![]() or
or
![]() .
This is because the function in the exponential in
Eq.(37) is proportional to
,
although the exceedance probability of
.
This is because the function in the exponential in
Eq.(37) is proportional to
,
although the exceedance probability of ![]() is proportional to
.
Thus,
is proportional to
.
Thus,
![]() decreases slower than
decreases slower than ![]() and has different power law in
comparison with
and has different power law in
comparison with ![]() and
and
![]() .
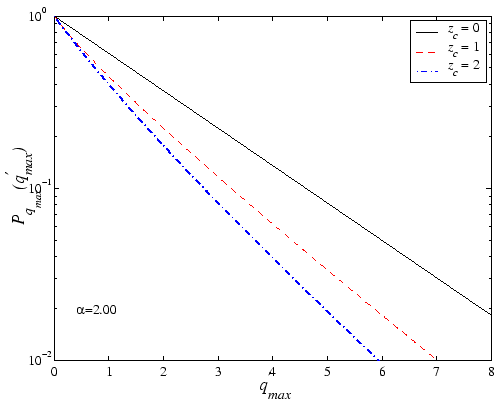
Fig.20 shows
the sensitivity of the exceedance probability of
.
Fig.20 shows
the sensitivity of the exceedance probability of
![]() to
the deck level
to
the deck level ![]() for the case of
for the case of ![]() =2.0.
With a change of
=2.0.
With a change of ![]() from
from ![]() =0 to
=0 to ![]() =2, the
exceedance probability seems almost constant.
The deck level doesn't effect significantly on the shape of the
exceedance probability of
=2, the
exceedance probability seems almost constant.
The deck level doesn't effect significantly on the shape of the
exceedance probability of
![]() than the value of
than the value of ![]()
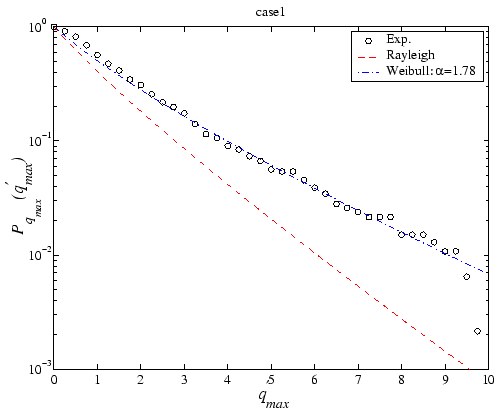
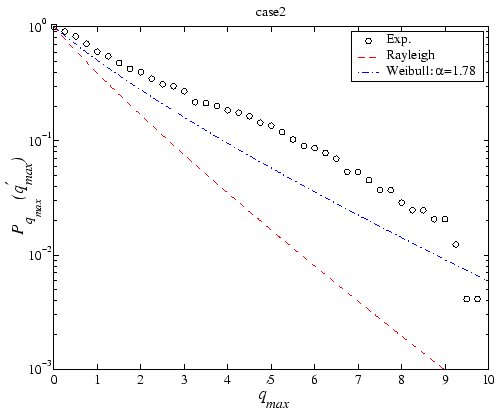
Fig.21 compares the PDF of the normalized maximum
wave overtopping rate
![]() for the experimental results with the
modified Rayleigh overtopping rate distribution, Eq.(38),
and the modified Weibull overtopping rate distribution,
Eq.(36).
The modified Weibull overtopping rate distribution shows
qualitatively better agreement with the experimental data
than the modified Rayleigh overtopping rate distribution,
particularly for larger values of
for the experimental results with the
modified Rayleigh overtopping rate distribution, Eq.(38),
and the modified Weibull overtopping rate distribution,
Eq.(36).
The modified Weibull overtopping rate distribution shows
qualitatively better agreement with the experimental data
than the modified Rayleigh overtopping rate distribution,
particularly for larger values of
![]() .
Fig.22 compares the exceedance probability of maximum
wave overtopping rate for the experimental results with
the modified Rayleigh overtopping rate distribution,
Eq.(39),
and the modified Weibull overtopping rate distribution,
Eq.(37).
The modified Weibull overtopping rate distribution shows
fair agreement with the experimental data for whole range of
.
Fig.22 compares the exceedance probability of maximum
wave overtopping rate for the experimental results with
the modified Rayleigh overtopping rate distribution,
Eq.(39),
and the modified Weibull overtopping rate distribution,
Eq.(37).
The modified Weibull overtopping rate distribution shows
fair agreement with the experimental data for whole range of
![]() in Case 1,
However, both of the modified Weibull overtopping rate distribution and
the modified Rayleigh overtopping rate distribution
are underestimated for Case 2.
This is because both of the modified Weibull
exceedance probability for
in Case 1,
However, both of the modified Weibull overtopping rate distribution and
the modified Rayleigh overtopping rate distribution
are underestimated for Case 2.
This is because both of the modified Weibull
exceedance probability for ![]() and
and
![]() are underestimated
in comparison with the experimental data.
The quantitative comparison with the theories and experimental
data will be required for large number of waves with different
conditions.
Nevertheless, the qualitative trends of
are underestimated
in comparison with the experimental data.
The quantitative comparison with the theories and experimental
data will be required for large number of waves with different
conditions.
Nevertheless, the qualitative trends of
![]() can be estimated by
Eq.(36) and (37).
can be estimated by
Eq.(36) and (37).
![\begin{displaymath}
q_{max} = (A-z_c)\omega A\left[ 1+ \frac{k}{2}(A+z_c) \right]
\end{displaymath}](img173.png)
![$\displaystyle \hspace{-2.0cm}\times
\exp\left\{
- \beta
\left\{
\left[
\frac{1}...
...\right]^{\alpha}
- z_c'^\alpha
\right\}
\right\}
d\ensuremath{q_{max}^\prime}\,$](img185.png)
![\begin{displaymath}
P_{\ensuremath{q_{max}}\,}(\ensuremath{q_{max}^\prime}\,, z...
...' \right)
\right]^{\alpha}
- z_c'^\alpha
\right\}
\right\}
\end{displaymath}](img186.png)