Next: Approximation of overtopping volume
Up: Mathematical formulations
Previous: Mathematical formulations
First, it is assumed unidirectional, stationarity and ergodicity for
wave field.
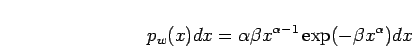
The most widely used statistical distribution describing wave height and
crest/trough amplitude is the Weibull distribution.
As a starting point of this study, it is assumed that the PDF of
wave/crest height can be described by the Weibull distribution
(KendallStuart) given by
 |
(1) |
where  and
and  are coefficients of the Weibull distribution,
and
are coefficients of the Weibull distribution,
and  is a random variable such as crest or wave height normalized,
for example, by the root-mean-square of the free surface fluctuations,
is a random variable such as crest or wave height normalized,
for example, by the root-mean-square of the free surface fluctuations,  .
For the cases of =2 with =1/8 or =1/2, Eq.(1) is
equivalent to the Rayleigh distribution for wave height or crest/trough
amplitude distributions, respectively.
In this study, the one parameter Weibull distribution is adopted to
simplify the problem.
Therefore, the value of is fixed as 1/8 for wave height
and 1/2 for crest height distributions, and is assumed larger than 1.
If vertical wave symmetry is assumed, then the wave height
.
For the cases of =2 with =1/8 or =1/2, Eq.(1) is
equivalent to the Rayleigh distribution for wave height or crest/trough
amplitude distributions, respectively.
In this study, the one parameter Weibull distribution is adopted to
simplify the problem.
Therefore, the value of is fixed as 1/8 for wave height
and 1/2 for crest height distributions, and is assumed larger than 1.
If vertical wave symmetry is assumed, then the wave height  is defined by
twice the wave amplitude
is defined by
twice the wave amplitude  .
For the Rayleigh distribution of wave height, Eq.(1) gives
.
For the Rayleigh distribution of wave height, Eq.(1) gives
and for the Rayleigh distribution of wave amplitude, Eq.(1)
gives
where the over-bar indicates the mean value.
For the deck overtopping problem, the wave crest amplitude is the
dominant variable compared with either the wave trough amplitude
or wave height.
Moreover, the wave nonlinearities enhance vertical asymmetry of waves,
and, as a result, the wave crest amplitude is
generally larger than its trough amplitude.
Therefore, only Eq.(1) for the PDF of wave crest
amplitude is used hereafter. This implies that for fixed =1/2,
is the only empirical parameter
controlling profile of the distribution.
The mean and rms value of Eq.(1) with  are given by
where  is the incomplete gamma function defined by
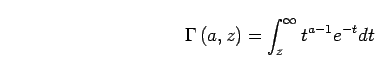 |
(8) |
Eq.(6) and (7) with =2 are equivalent to
the Rayleigh distribution defined by Eq.(4) and (5).
If the deck is thin compared to the incident wave amplitude, then
the influence of the
deck on the incident wave profile is negligible.
In this case, the PDF of the wave amplitude distribution on the deck can
be described by a truncated form of Eq.(1):
![\begin{displaymath}
p_w(A')dA'
=
\left\{
\begin{array}{l@{\ \ \ }l}
\alpha\...
...]dA' & A' \ge z_c' \\
0 & A' < z_c' \\
\end{array} \right.
\end{displaymath}](img31.png) |
(9) |
where the  indicates a normalized value, and
 and
and  are the wave amplitude and deck level
normalized by the
rms value of the surface elevation in the absence, or
well seaward, of the deck.
Eq.(9) gives
the exceedance probability of the wave amplitudes on the deck:
are the wave amplitude and deck level
normalized by the
rms value of the surface elevation in the absence, or
well seaward, of the deck.
Eq.(9) gives
the exceedance probability of the wave amplitudes on the deck:
![\begin{displaymath}
P_w(A')
=
\left\{
\begin{array}{l@{\ \ \ }l}
\exp\left[...
...ght] & A' \ge z_c' \\
1 & A' < z_c' \\
\end{array} \right.
\end{displaymath}](img35.png) |
(10) |
Obviously, the equivalence assumption of between
Eq.(1) and Eq.(9) depends on the thickness of
the deck in comparison with the incident wave height.
The validity of equivalency of will be checked later through
comparisons with laboratory observations.
Figure 1:
Illustration of geometrical location of deck and incident wave.
=10cm
![\epsfbox[18 361 478 600]{figures/overtoppingillustration.eps}](img36.png)
![\includegraphics[width=10.0cm]{figures/overtopping_illustration.eps}](img37.png)
|
Next: Approximation of overtopping volume
Up: Mathematical formulations
Previous: Mathematical formulations
2002-11-26