 derived from the Edgeworth-Rayleigh distribution is given by
 special sum and (see Mori and Yasuda, 1996; Mori and Yasuda, 2002b).
The exceedance probability of the wave height ![]() derived from the Edgeworth-Rayleigh distribution is given by
derived from the Edgeworth-Rayleigh distribution is given by
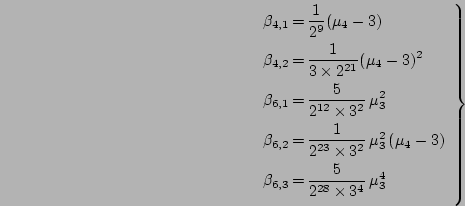 polynomials for
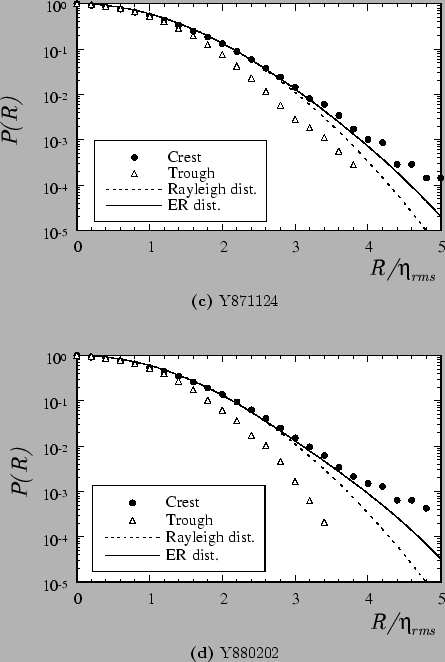
The exceedance probability of the wave amplitudes are shown in 8.
The solid circle, 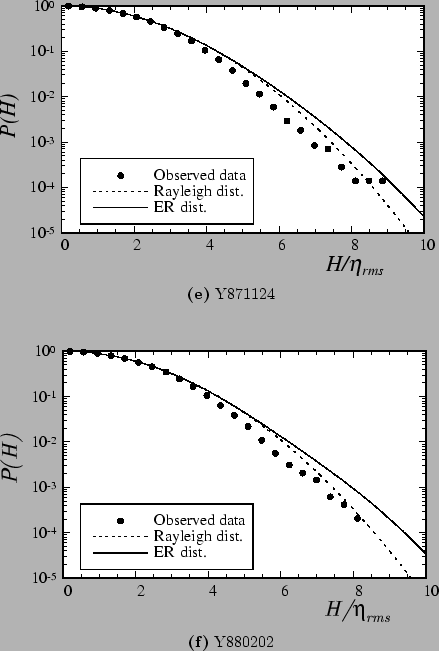 , denotes the exceedance probability of the crest amplitude obtained from the observed data and open triangle,
 ![]() , denotes trough amplitude data.
The dotted line indicates the exceedance probability from the Rayleigh distribution and solid line the probability by Eq.(1).
The observed results show a tendency to increase with the amplitudes in comparison with the Rayleigh distribution.
The probability from the Rayleigh distribution is underestimated for crest amplitude but is overestimated for trough amplitudes.
The probability by Eq.(1) shows better agreement with the crest amplitude of observed data than that of the Rayleigh distribution, although it overestimates the trough amplitude much rather than the Rayleigh distribution.
, denotes trough amplitude data.
The dotted line indicates the exceedance probability from the Rayleigh distribution and solid line the probability by Eq.(1).
The observed results show a tendency to increase with the amplitudes in comparison with the Rayleigh distribution.
The probability from the Rayleigh distribution is underestimated for crest amplitude but is overestimated for trough amplitudes.
The probability by Eq.(1) shows better agreement with the crest amplitude of observed data than that of the Rayleigh distribution, although it overestimates the trough amplitude much rather than the Rayleigh distribution.
Comparisons of the exceedance probability of the wave heights between the observed results and theoretical ones of the Rayleigh distribution and Eq.(3) are shown in 9.
Here the solid circle, , denotes the observed data, the dotted line and the solid line indicate the Rayleigh distribution and Eq.(3), respectively, as before.
When the wave height follow the Rayleigh distribution, the root-mean-square value of the sea surface elevation ![]() is known to be related to
is known to be related to ![]() by
by ![]() =
=![]() /4.004.
Hence, one of the popular criteria of the freak wave case,
/4.004.
Hence, one of the popular criteria of the freak wave case,
![]() , can be rewritten approximately as
, can be rewritten approximately as
![]() .
The observed data show the tendency to agree with the Rayleigh distribution rather than Eq.(3), although the Eq.(1) shows better agreement more than the Rayleigh distribution for the amplitude distribution.
.
The observed data show the tendency to agree with the Rayleigh distribution rather than Eq.(3), although the Eq.(1) shows better agreement more than the Rayleigh distribution for the amplitude distribution.
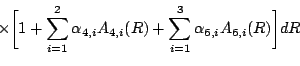
![$\displaystyle \hspace{0.5cm}
\times
\biggl[ 1
+\sum_{i=1}^{2}\alpha_{4,i}A_{4,i}(R)
+\sum_{i=1}^{3}\alpha_{6,i}A_{6,i}(R)
\biggr]
dR$](img35.png)
![$\displaystyle \hspace{0.5cm}
\left[ 1+\sum_{i=1}^{2}\beta_{4,i}E_{4,i}(H)
+\sum_{i=1}^{3}\beta_{6,i}E_{6,i}(H)
\right]$](img41.png)