The laboratory experiment was conducted in the glass channel which is 65m long, 1m wide, 2m high and was filled to a depth of about 1.0m. Water surface displacements were measured with twelve capacitance type wave gages. The measurements with a sampling frequency of 32Hz were performed for over 330s. No corrections were applied for filter response of the wire.
The initial spectra were given by using the Wallops type spectra with band widths of ![]() =5, 10, 30, 60 and 100, and peak frequency of
=5, 10, 30, 60 and 100, and peak frequency of ![]() =1Hz and a characteristic water depth of
=1Hz and a characteristic water depth of ![]() =3.99, so that the waves were deep water waves.
Here,
=3.99, so that the waves were deep water waves.
Here, ![]() is the water depth.
The number of waves were about 350-450.
Initial phases of the waves were given by uniformly distributed random numbers.
Breaking waves were observed for higher waves with the steepness that the value of
is the water depth.
The number of waves were about 350-450.
Initial phases of the waves were given by uniformly distributed random numbers.
Breaking waves were observed for higher waves with the steepness that the value of ![]() is larger than 0.13.
Consequently, waves of 24 cases were generated under the combination of the spectrum bandwidth parameter
is larger than 0.13.
Consequently, waves of 24 cases were generated under the combination of the spectrum bandwidth parameter ![]() and the wave steepness.
and the wave steepness.
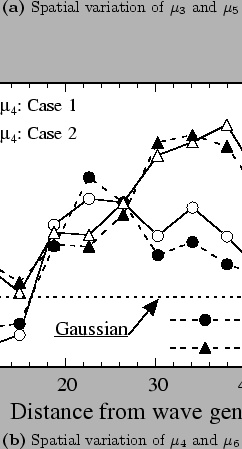 |
Typical measured two cases are shown in Table 1 for breaking and non-breaking cases. The spatial variations of higher order moments for case 1 and 2 are shown in 3. These show that the higher order moments are fluctuated until the location 20m distant from the wave generator (that is about 13 wave lengths of peak frequency). There are marked increase in the moments more than 20m away from the wave generator. All of the higher order moments are not equal to the Gaussian, more and less. The odd order moments 3 and 5 seem to level out 20m away from wave generator, although the even order moments 4 and 6 are still increased. The higher order moments are generally influenced by the sampling frequency, but these trends do not depend on the sampling of data in our experiments. In addition, the spatial variations of 5 and 6 are similar to those of 3 and 4, respectively. These indicates the non-Gaussian properties of surface elevations.
The exceedance probability of wave heights are shown in and 7.
The histogram and filled circles 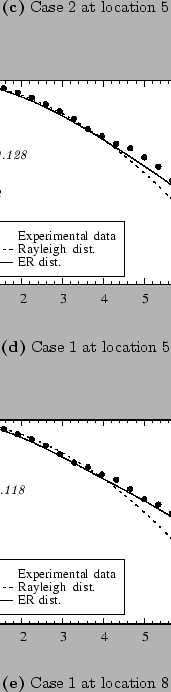 denotes experimental data, dotted line the Rayleigh distribution and solid line the Edgeworth-Rayleigh distribution.
The Edgeworth-Rayleigh distribution for the exceedance probability of wave heights show good agreement with the experimental data in comparison with the Rayleigh distribution.
The number of waves decrease as wave heights getting larger, so the number of waves are quite few in the range
denotes experimental data, dotted line the Rayleigh distribution and solid line the Edgeworth-Rayleigh distribution.
The Edgeworth-Rayleigh distribution for the exceedance probability of wave heights show good agreement with the experimental data in comparison with the Rayleigh distribution.
The number of waves decrease as wave heights getting larger, so the number of waves are quite few in the range
![]() in 7.
The Edgeworth-Rayleigh distribution agrees with the experimental data, even if the number of waves are not so many.
Moreover, the Edgeworth-Rayleigh distribution agrees with the experimental data for larger value of
in 7.
The Edgeworth-Rayleigh distribution agrees with the experimental data, even if the number of waves are not so many.
Moreover, the Edgeworth-Rayleigh distribution agrees with the experimental data for larger value of
![]() (
(
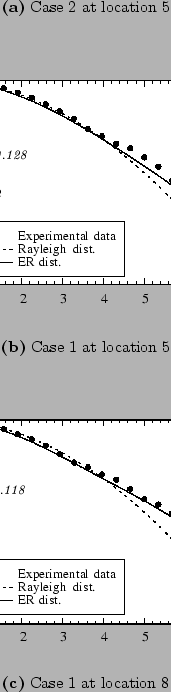 ), such as 7(c).