Only giant freak waves that took place during the continuous observations of over 20 hours are used for the present study. Each of the
gathered cases are then analyzed for their probability of occurrence and general statistics by assuming the process to be stationary, since most of the conventional statistical theories for wave parameters are formulated under the assumption of stationarity.
In essence, however, it is really inexplicable to expect that one can connect, in a strict sense, the observed data from the prevailing nonstationary sea states with that of statistical theories based on the stationarity assumption.
A basic stationarity test (e.g. Bendat and Piersol, 1971) was used to examine the parameters ![]() and
and ![]() in order to select data set that passed the stationarity test from the over 20 hours continuous recordings.
The total duration of time periods of the available continuous observations, their numbers of zero-down-crossing waves within each period,
in order to select data set that passed the stationarity test from the over 20 hours continuous recordings.
The total duration of time periods of the available continuous observations, their numbers of zero-down-crossing waves within each period, ![]() , along with various wind and wave statistical parameters calculated from each 30 min recorded data that contained a giant or freak wave incidence are shown in Table 2.
The data codes in the first column of the table are designated by the first letter of Yura, Y, followed year, month, date of two digit each, for instance Y871124 represents the case of 24th of November in 1987. Other parameters include
, along with various wind and wave statistical parameters calculated from each 30 min recorded data that contained a giant or freak wave incidence are shown in Table 2.
The data codes in the first column of the table are designated by the first letter of Yura, Y, followed year, month, date of two digit each, for instance Y871124 represents the case of 24th of November in 1987. Other parameters include
![]() and
and ![]() that denote the mean wind speed and direction respectively in the 30min record unit,
that denote the mean wind speed and direction respectively in the 30min record unit,
![]() , where
, where ![]() =
=
![]() the characteristic steepness parameter,
the characteristic steepness parameter, ![]() skewness and
skewness and ![]() the Groupings Factor.
Since the values of
the Groupings Factor.
Since the values of ![]() are approximately 10,000 or more, the sample sizes are sufficiently large to investigate population distribution of waves containing giant freak waves.
are approximately 10,000 or more, the sample sizes are sufficiently large to investigate population distribution of waves containing giant freak waves.
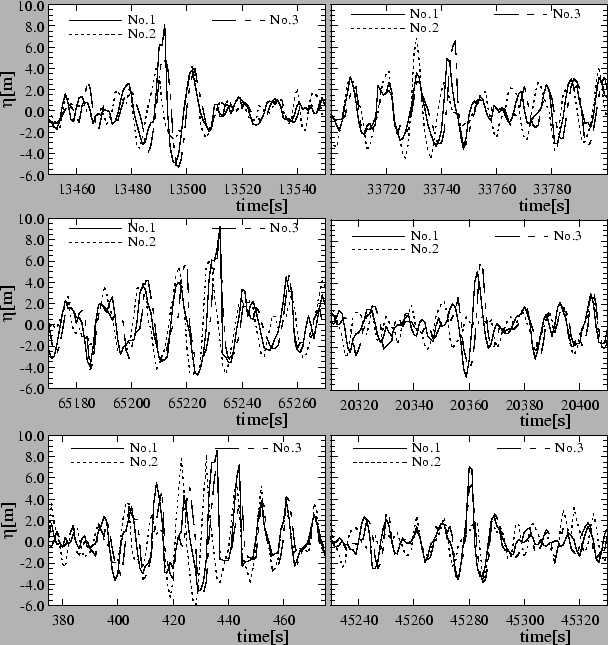 |
3 shows some examples of temporal water surface elevations of the giant freak waves measured simultaneously at the three recording points (No.1, 2 and 3 in 2). Note that the profiles within the proximity are not similar. One profile with a freak wave which is localized with a long crest, another one has a single and steep crest which is asymmetric, and still the other one shows a moderate grouping profile. These localized characteristics of freak wave profiles may depend on local linear and nonlinear properties which will be discussed later.
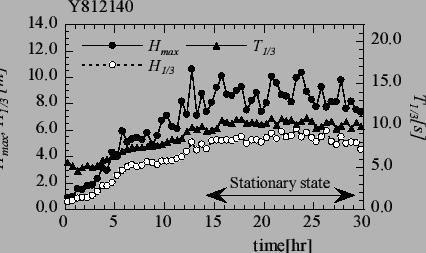
An example, Y881214, with time histories of ![]() ,
, ![]() , and
, and ![]() in continuous 30min recording units from the beginning is shown in 4.
The values of
in continuous 30min recording units from the beginning is shown in 4.
The values of ![]() exhibit greater fluctuations in time and space than the values of
exhibit greater fluctuations in time and space than the values of ![]() .
In this example, time sequence of
.
In this example, time sequence of ![]() between 15-28 hours satisfied the statistical stationary states.
Hence, the observed data including freak wave can be easily compared with statistical theories.
The stationarity of the observed data were satisfied not only for
between 15-28 hours satisfied the statistical stationary states.
Hence, the observed data including freak wave can be easily compared with statistical theories.
The stationarity of the observed data were satisfied not only for ![]() and
and ![]() , but also for wind speed
, but also for wind speed ![]() , wind direction
, wind direction ![]() and wave direction
and wave direction
![]() (Yasuda et al., 1997; Mori and Yasuda, 2002a).
(Yasuda et al., 1997; Mori and Yasuda, 2002a).