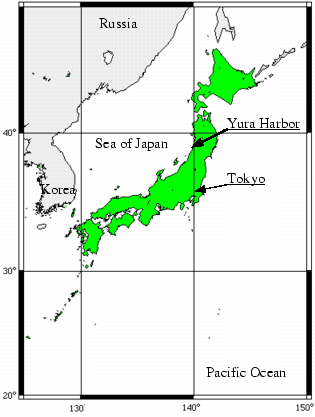
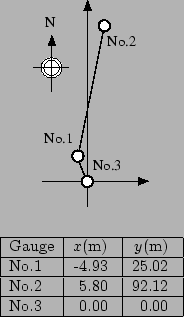
Temporal sea surface elevations were measured with ultrasonic-type wave gages installed at three points (2) in 43 m water depth. The measurements were made normally in 20min at intervals of two hours, and further continuous recordings over 20 hours were made temporarily when sea conditions became stormy. The continuous data were divided into 30min record unit, from which wave statistics were calculated at intervals of 30min. General wave statistics of the observed waves were presented by Yoshimoto and Kato (1992) and wind field statistics including the weather conditions were reported by Yasuda et al. (1997) and Mori et al. (2000).
| Observed date |
|
|||||
| 1987/01/01 05:35 | 11.5 | 9.1 | 2.17 | 18.1 | NW | |
| 1987/01/04*12:18 | 10.8 | 9.2 | 2.04 | 20.9 | WNW | |
| 1987/01/18*10:28 | 10.0 | 9.6 | 2.08 | 20.0 | W | |
| 1987/02/16 11:35 | 11.2 | 9.5 | 2.11 | 15.8 | WNW | |
| 1987/02/26*23:39 | 11.3 | 10.1 | 1.98 | 19.6 | W | |
| 1987/03/25*17:58 | 11.1 | 10.4 | 1.88 | 23.8 | SW | |
| 1987/09/01*02:18 | 13.1 | 11.7 | 1.96 | -- | -- | |
| 1987/11/24*11:42 | 13.6 | 10.8 | 2.67 | 13.6 | WNW | |
| 1987/12/17*10:13 | 14.6 | 10.6 | 2.06 | 20.8 | WNW | |
| 1988/01/09*22:48 | 10.9 | 9.2 | 2.06 | 16.4 | WNW | |
| 1988/02/03*11:13 | 14.9 | 11.2 | 2.22 | 17.6 | WNW | |
| 1988/12/15*09:03 | 12.8 | 10.9 | 2.13 | 20.9 | WSW | |
| 1989/11/19*23:42 | 12.4 | 10.9 | 1.82 | 15.7 | WSW | |
| 1990/01/25*18:34 | 10.7 | 9.5 | 2.10 | 17.8 | WNW |
Table 1 shows wave and wind statistics at all the observation times when waves with the maximum wave height ![]() exceeded 10m were recorded during the four years the observations were in place.
The statistics shown in the table refer to those of (Yoshimoto and Kato, 1992) who analyzed wave data by using zero-up-crossing method.
The asterisk * denotes the data obtained at the times when the continuous observations were carried out.
It is of interest to note that most of the maximum waves listed in Table 1 can be considered as giant freak waves.
This aspect of the findings demonstrates that giant freak waves may occasionally occur without particular regard to wave focusing or directionality. While they are basically during strong wave cases, but in general the cases only examplify normal wind conditions in winter season.
exceeded 10m were recorded during the four years the observations were in place.
The statistics shown in the table refer to those of (Yoshimoto and Kato, 1992) who analyzed wave data by using zero-up-crossing method.
The asterisk * denotes the data obtained at the times when the continuous observations were carried out.
It is of interest to note that most of the maximum waves listed in Table 1 can be considered as giant freak waves.
This aspect of the findings demonstrates that giant freak waves may occasionally occur without particular regard to wave focusing or directionality. While they are basically during strong wave cases, but in general the cases only examplify normal wind conditions in winter season.